made with react.js
Description
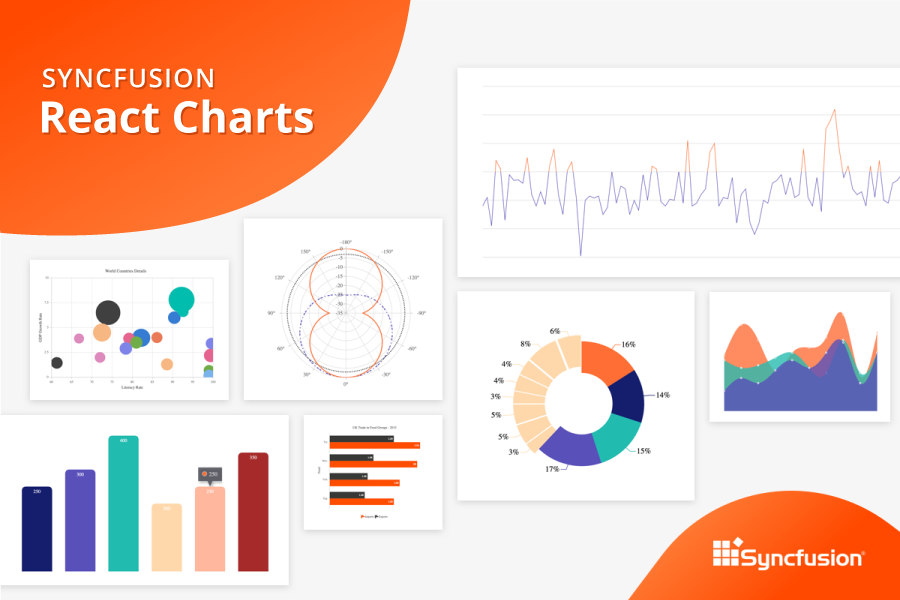
Interactive React Charts & Graphs
"The Syncfusion React charts library is a well-crafted easy-to-use charting package that offers 55+ chart types with elegant animation.
It can be used to visualize the data with user interactivity and provides customizing options to configure the data visually. All chart elements are rendered as Scalable Vector Graphics (SVG), which avoid loss in the quality on scaling."
Creator
Syncfusion
@Syncfusion
@syncfusion.bsky.social

Social Media Links