made with react.js
Description
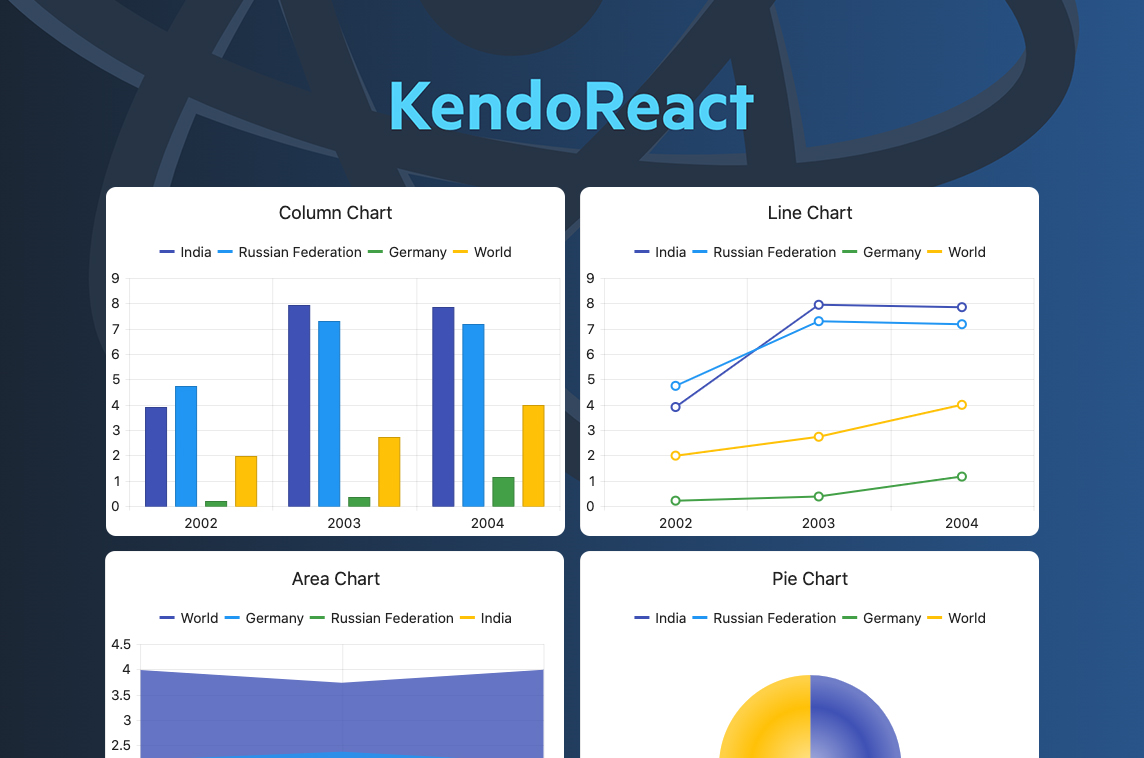
Charts Library
"The React Charts library found in KendoReact is a powerful data visualization tool that can fit into any application. This package includes over 16 different types of charts, all with built-in support for interactivity, tooltips, zooming and panning, and much more.
This React chart library is built from the ground up, without any dependencies on third party libraries. Each chart can be rendered either as an SVG or a Canvas element, defined by a single property, and can be exported to various formats such as an image or PDF.
The KendoReact Charts work well as standalone series and many can be mix-and-matched and rendered in a single chart. Available chart types include simple bar and area charts, funnel charts, radar charts, scatter plots and more."

Social Media Links