made with react.js
Description
Pivot Table & Charts Component
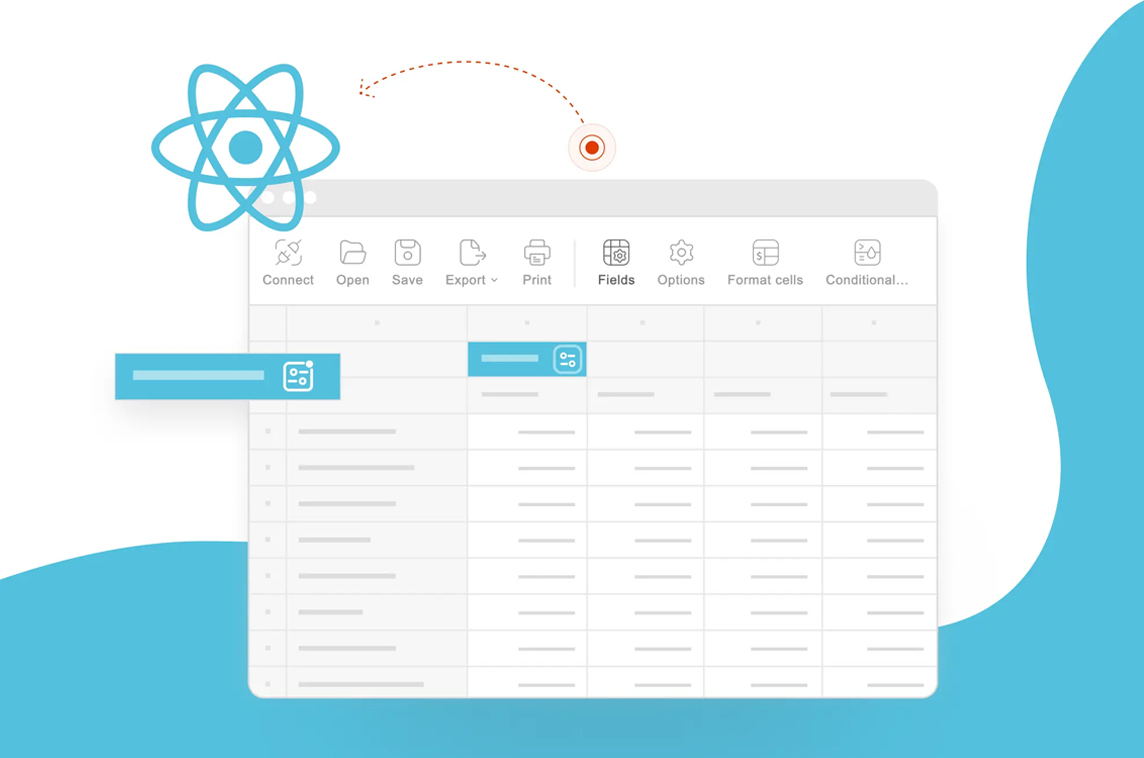
"The Flexmonster pivot table is an enterprise-grade React component for visualizing and analyzing complex data directly in the browser. It lets users group, filter, sort, and drill through data, then build interactive reports. Built for performance, it handles 1M+ rows of grouped data and datasets over 1GB with fast rendering and smooth scrolling.
It connects to virtually any data source (JSON, CSV, SQL and NoSQL databases, OLAP cubes, Elasticsearch, and MongoDB) and reports can be exported to PDF, Excel, HTML, CSV, or PNG in one click.
An official React wrapper makes integration into any React app straightforward, and an extensive JavaScript API gives you full control to customize layouts, formatting, and reporting scenarios to match your product."
-

- 📊 Statistics
- ✏️ Request update